
Reliability
Explore our infographics detailing reliability of coal power stations over a recent six-month period.

Availability
Fossil fueled power stations often break down, meaning we can’t rely on them when needed.
Over the twelve months to 30 November 2025, an average of 4.7 GW of coal fired generating capacity has been unavailable.
Queensland
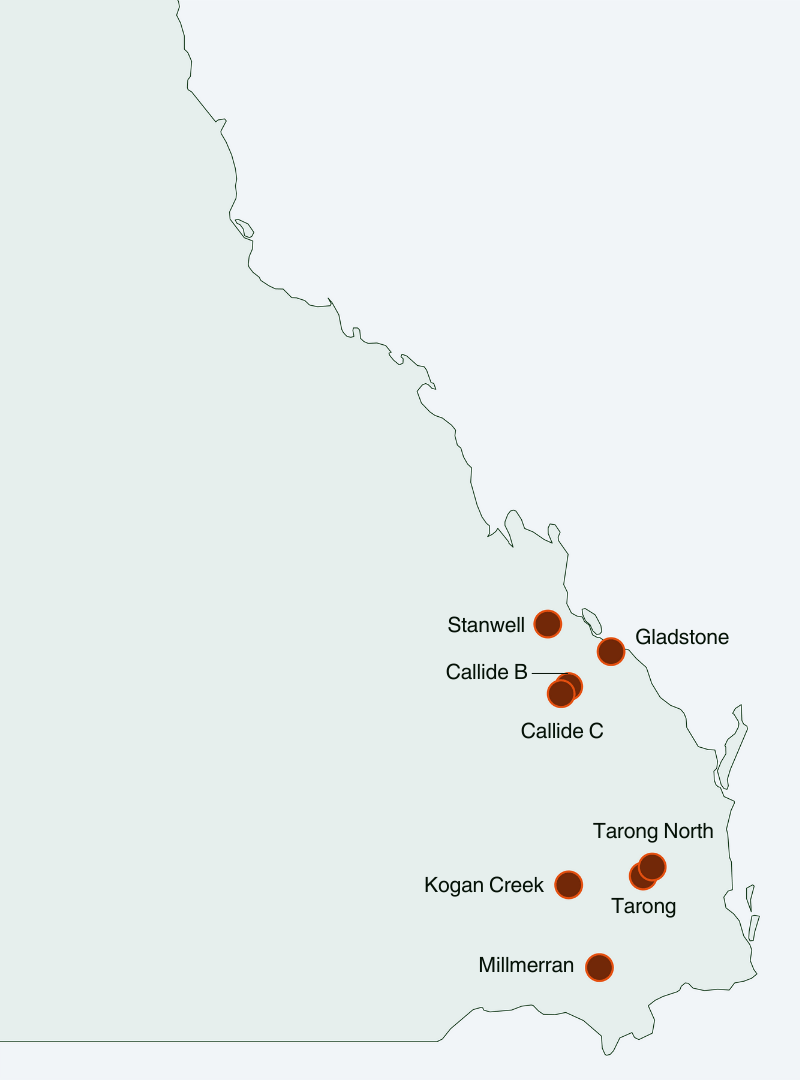
Over the six months to
30 November 2025
, an average of MW, or %, of coal fired generating capacity has been unavailable in Queensland – the equivalent of every unit being offline for out of the 180 days.
Power station
Capacity
Average unavailable capacity
Equivalent offline days
Tarong North
443
MW
43
%
0
/
180
Gladstone
1680
MW
37
%
0
/
180
Callide C
886
MW
37
%
0
/
180
Millmerran
852
MW
26
%
0
/
180
Callide B
700
MW
20
%
0
/
180
Tarong
1400
MW
16
%
0
/
180
Kogan Creek
744
MW
16
%
0
/
180
Stanwell
1460
MW
9
%
0
/
180
New South Wales

Over the six months to
30 November 2025
, an average of MW, or %, of coal fired generating capacity has been unavailable in New South Wales – the equivalent of every unit being offline for out of the 180 days.
Power station
Capacity
Average unavailable capacity
Equivalent offline days
Vales Point B
1320
MW
29
%
0
/
180
Eraring
2880
MW
27
%
0
/
180
Bayswater
2640
MW
19
%
0
/
180
Mt Piper
1400
MW
16
%
0
/
180
Victoria

Over the six months to
30 November 2025
, an average of MW, or %, of coal fired generating capacity has been unavailable in Victoria – the equivalent of every unit being offline for out of the 180 days.
Power station
Capacity
Average unavailable capacity
Equivalent offline days
Yallourn W
1480
MW
33
%
0
/
180
Loy Yang A
2210
MW
17
%
0
/
180
Loy Yang B
1000
MW
6
%
0
/
180